
There are basically two types of chart patterns
1. Reversal patterns
2. Continuation Patterns
Again In Reversal patterns we have two sub sections.
They are
I. Bullish Reversal Patterns
II. Bearish Reversal Patterns
Let us start With Bullish Reversal Patterns
I. Bullish Reversal Patterns
These Bullish Reversal Patterns are useful to confirm a Bullish trend.
They are :
a. Double Bottom Pattern
b. Head & shoulders Pattern
c. Rounding Bottom Pattern
d. Triple Bottom Pattern
II. Bearish Reversal Patterns
Bearish Reversal Patterns are useful to confirm a Bearish trend.
a. Double Top Pattern
b. Rounding Top Pattern
c. Head & shoulders Top Pattern
d. Triple Top Pattern
Beyond these patterns we have continuation patterns
Symmetrical Triangles
Ascending Triangles
Desending Triangles
Rectangles
Flags & Pennants
Double Bottom Pattern
Double bottom is a reversal pattern that occurs after an extended downturn. The pattern consists of two consecutive lows that are almost equal with some moderate peak in between them. Volumes in formation of second high are normally lower than in the first high.
The formation of second low is at low volumes and buyers will be aggressive to drive up the prices once the low is held. Second low may be equal or even slightly higher than the first low, but the second low doesn’t hold for long. This pattern will complete once the price makes the second low and go above the peak it formed between the first and second low. Once the price drive above the previous peak high (reaction high), buying opportunity emerges to buy above the previous reaction high.
The previous reaction high which acted as resistance will now turn into support level. Smart traders buy the share above the reaction high with stop loss slightly below the previous reaction high. Target is the distance between the peak high and the lows.
The distance between the two lows should be at least a month for a swing trader to capitalize this pattern. An example for double bottom is given:
Here I am updating DLF EOD chart
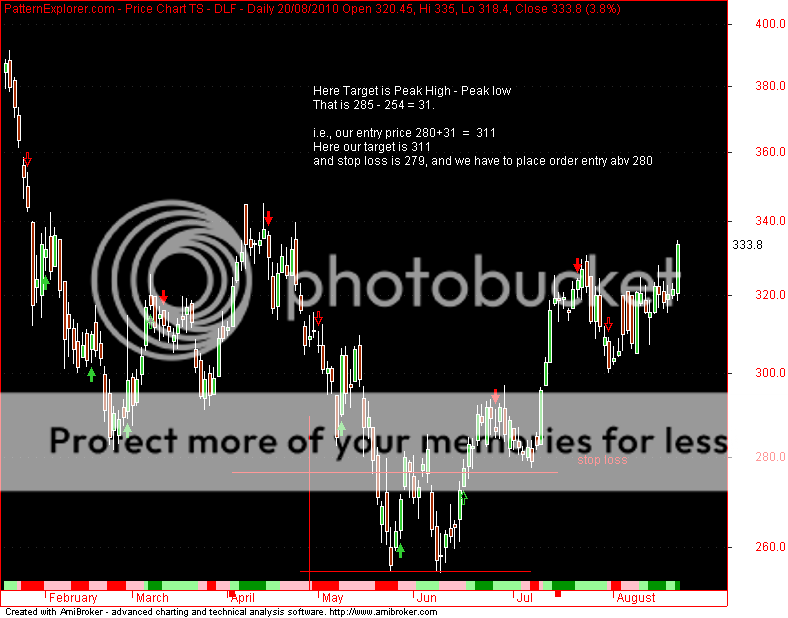
Remember in this pattern Stop loss should be lowest support line near the peak high.
Head & shoulders pattern
Bearish, reversal pattern signaling the end of the current uptrend
Basically looks like the silhouette of a human left shoulder, head and the right shoulder
Like the Double Top, strong volume push prices upwards forming the "left shoulder". The pullback is on lesser volume, then another strong rally on good volume, forming the "head" … but this time, the volume causing this rally although forming higher prices, is now on relatively lower volume as
compared to the volume in the rally causing the left shoulder … as the stock pulls back to the neckline, and starts rallying again to form the right shoulder, now volume is very noticeably lighter.
The break of the neckline confirms the H & S pattern (Neckline is the line connecting the two troughs on either side of the head).Volume expansion is noticed as the pattern confirmation takes place … and the stock or index is now in a down trend. (Reverse happens now … vol. expands on the down fall and decreases on a return move up)
Trading-Wise -> ENTRY
The first down day below the neckline confirms the pattern... .short as the neckline breaks or
enter short on a weak rally back to the area of the neckline.This line that was formerly strong support now acts as a stiff resistance.Short half on that return move,and the other half below the low of the confirmatory bar.
TARGET
First target would be … calculate the difference from the head to neckline.Add that to the low of the bar that confirmed the pattern.
STOP
The height of the right shoulder
Or if you are low risk trader, keep stop loss as just abv the neck line
One Important Condition
Once the neckline gets broken, expect a return move … but at all costs the price should not re-break the neckline upwards. If this happens, it is called a FAILED H&S PATTERN. Like a failed breakdown, this acts as a bear trap and is bullish. So get out if that neckline gets broken back
upwards.
Here I am uploading ESCORTS EOD chart as example

Rounding Bottom Pattern
A rounding bottom, also referred to as a saucer bottom, is a long-term reversal pattern that signals a shift from a downtrend to an uptrend. This pattern is traditionally thought to last anywhere from several months to several years. Due to the long-term look of these patterns and their components, the signal and construct of these patterns are more difficult to identify than other reversal patterns.
A rounding-bottom pattern looks similar to a cup and handle, but without the handle. The basic formation of a rounding bottom comes from a downward price movement to a low, followed by a rise from the low back to the start of the downward price movement - forming what looks like a rounded bottom.
The pattern should be preceded by a downtrend but will sometimes be preceded by a sideways price movement that formed after a downward trend. The start of the rounding bottom (its left side) is usually caused by a peak in the downward trend followed by a long price descent to a new long-term low.
Entry abv the resistance line.
stoploss just below the resistance line
Target the distance from the resistance line to the lower value of the pattern
Here I am uploading EXCELINDUS chart with rounding bottom pattern

Triple Bottom – Triple Bottom Pattern
A triple bottom is a reversal pattern with bullish implications composed of three failed attempts at making new lows in the same area, followed by a price move up through resistance. This pattern is rare, but a very reliable buy signal.
Context: This pattern is generally found within low trading ranges following downtrends, and the break of resistance which confirms this pattern is what makes it a reversal pattern.
Appearance: Triple bottom patterns are found at the end of downtrends where price makes three attempts at a new low. These attempts are spaced apart often by multiple weeks. The support area which price fails to penetrate does not have to be the exact same price, and multiple attempts to decline into the same area may be considered a potential triple bottom. During this time, a support level is established which forms a trading range between the lows and overhead resistance. The upside break of this resistance confirms the triple bottom pattern, which is a technical buy signal.
Breakout Expectation: Triple bottom breakouts often will make at least a measured move higher. To determine the upside price projection from this pattern, measure the height of the trading range during the triple bottom pattern and add it to the resistance level once it is penetrated to the upside.
Here I am uploading BOMDYEING Day Chart with tripple bottom

we have completed the Bullish Reversal patterns. Next we go further...STEP BY STEP
